 Sample report · Fictional case for demonstration
This report is prepared for
Sample Mutual Insurance Company
Special Investigations Unit
Regarding
2022 Volkswagen Tiguan vs. GMC SUV
Findings at a Glance
Assignment
Accident Dynamics USA was requested to determine whether the property damage to the involved vehicles and the Event Data Recorder (EDR) information recovered from the 2022 Volkswagen Tiguan are consistent with the circumstances reported for this loss, and to evaluate both vehicles for any signs of Artificially Enhanced Damage (AED).
Documents Reviewed
- Assignment letter.
- Bosch CDR report for the 2022 Volkswagen Tiguan, including the data limitations.
- Field inspection photographs of the Tiguan at the storage facility.
- Photographs of the GMC supplied by the claimant.
- Scene photograph taken by the insured.
- Recorded statement and examination under oath (EUO) of the insured driver.
- Repair estimate for the GMC.
Conclusions
Based on a thorough review of the submitted material, collision reconstruction training, and professional experience, it is the opinion of this expert that a low-speed collision between the Volkswagen Tiguan and the GMC occurred on the reported date, but that it did NOT occur as the insured described, and that the damage to the GMC's right-side door frame and rocker is NOT consistent with this collision.
The Tiguan's EDR recorded a non-deployment frontal event with a delta-V of 5.6 mph. The pre-crash data shows the Tiguan pulling away from a stop with the steering wheel turned to the right and reaching about 11 mph with no braking. This does not match the insured's account of driving straight through a missed stop sign at about 40 mph. The Tiguan's bumper and grille damage is consistent with the recorded event. The GMC's damage includes sharply localized, edge-loaded creases that a vehicle bumper would not produce, and indicators consistent with possible AED were identified. AED cannot be confirmed without a physical inspection of the GMC.
Discussion
The only questions considered for the purpose of this report are those requested in the case assignment.
Background Information
The loss was reported to have occurred at about 10:30 p.m. on August 14, 2026, at the intersection of Ridgecrest Avenue and Canyon View Boulevard in Sample City, California. Ridgecrest Avenue is controlled by a stop sign at Canyon View Boulevard. According to the insured's recorded statement, he had been driving from a nearby store, stopped for an extended period "to think," and then proceeded downhill on Ridgecrest Avenue, where he "missed a stop sign" and collided with a GMC traveling west on Canyon View Boulevard. The claimant reported damage along the right side of the GMC.
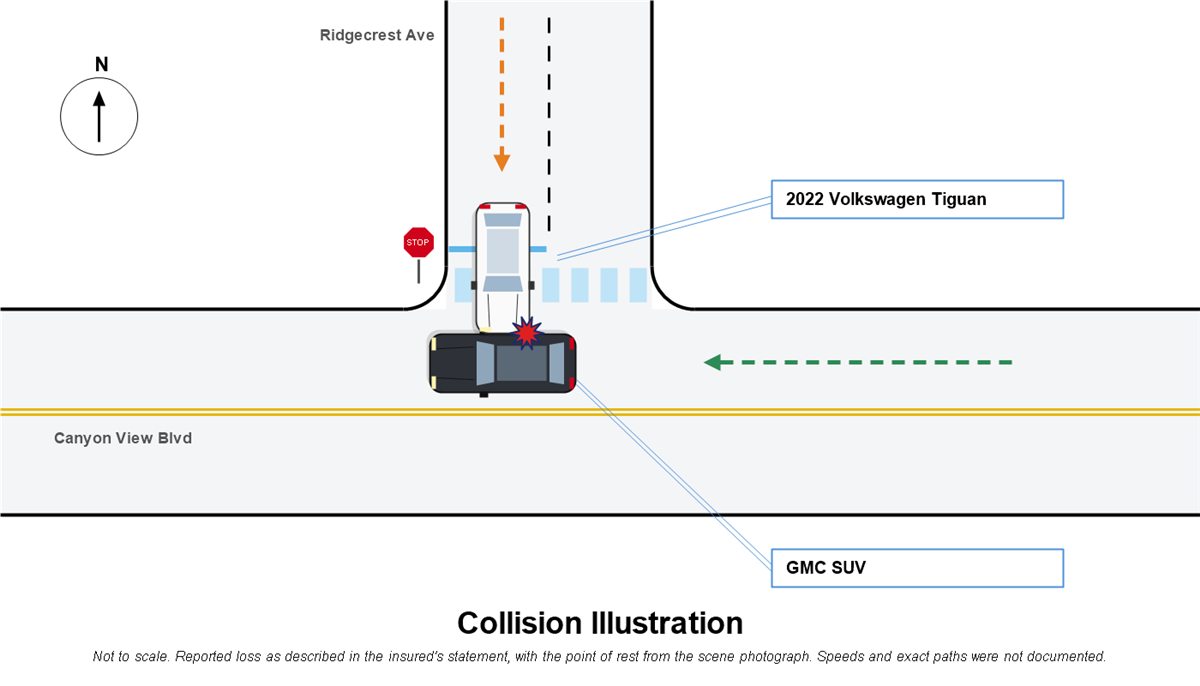
| Figure 1 | Accident Dynamics USA Illustration | |
Vehicle Description
The GMC was not inspected, and its model was not identified in the materials provided.
Information from Bosch CDR Report
The Event Data Recorder (EDR) in the Tiguan's airbag control module (ACM) was downloaded with the Bosch CDR tool. The VIN reported by the module matched the vehicle. The report documents one stored event:
The module's clock places the event at 10:27 p.m. on the reported date of loss, and the event mileage is 16 miles below the odometer reading at inspection. Together these indicate that the recorded event is the reported collision and that the Tiguan was driven only a short distance afterward.
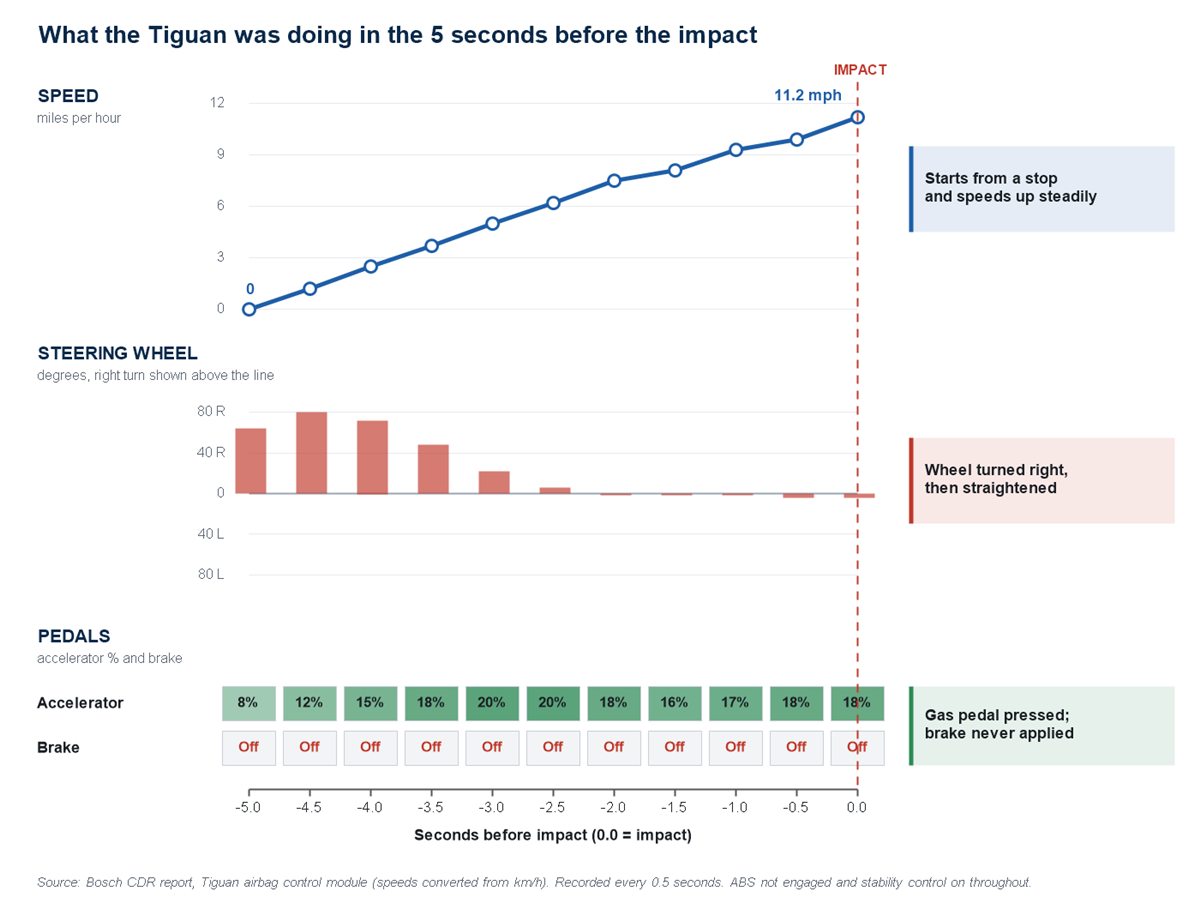
| Figure 2 | Bosch CDR Report Data | |
The Bosch CDR reports speeds in kilometers per hour; they are converted to miles per hour throughout this report. The five-second pre-crash data shows the Tiguan at 0 mph five seconds before the event, then accelerating steadily to 11.2 mph (recorded as 18 km/h). The accelerator pedal was applied throughout, between 8% and 20%. The service brake was recorded as "Off" for the entire pre-crash period, ABS was not engaged, and speed increased at every sample, so no braking occurred before the event.
The CDR data limitations define positive steering values as clockwise, a right turn. The steering input was 64 to 80 degrees to the right at the start of the record and unwound toward center as speed increased, reaching zero 2.0 seconds before the event. At the low speeds involved, the Tiguan's heading would have changed only slightly. The data is consistent with a vehicle starting from a stop with the steering wheel turned to the right and then straightening, not with continuous straight travel through the intersection.
As a check, conservation of momentum was applied to the reported contact. The GMC model was not identified, so its weight was bracketed between 3,500 and 5,800 pounds, the approximate range of GMC SUVs. The Tiguan's weight with its driver is approximately 3,950 pounds, and its speed at impact was 11.2 mph. Because the GMC was crossing in front of the Tiguan, it contributed essentially no speed in the Tiguan's direction of travel.
Momentum is conserved during the collision, and the coefficient of restitution describes how much the vehicles rebound from each other:
m1v1 + m2v2 = m1v1′ + m2v2′ v2′ − v1′ = e (v1 − v2)
Solving these two equations for the Tiguan's change in velocity gives:
ΔV1 = [ m2 ÷ (m1 + m2) ] × (1 + e) × Vc
Light GMC (3,500 lb, e = 0):
ΔV1 = [ 3,500 ÷ (3,950 + 3,500) ] × (1 + 0) × 11.2 = 0.470 × 1.0 × 11.2 = 5.3 mph
Heavy GMC (5,800 lb, e = 0.2):
ΔV1 = [ 5,800 ÷ (3,950 + 5,800) ] × (1 + 0.2) × 11.2 = 0.595 × 1.2 × 11.2 = 8.0 mph
The recorded delta-V of 5.6 mph falls within the expected range of 5.3 to 8.0 mph, which supports that the event was produced by contact with the GMC. The average deceleration over the 110 milliseconds in which the maximum was reached is:
a = ΔV ÷ Δt = (5.6 mph × 1.467 = 8.2 ft/s) ÷ 0.110 s = 74.7 ft/s² ÷ 32.2 = 2.3 g
The results are summarized below.
Information from Photographic Evidence
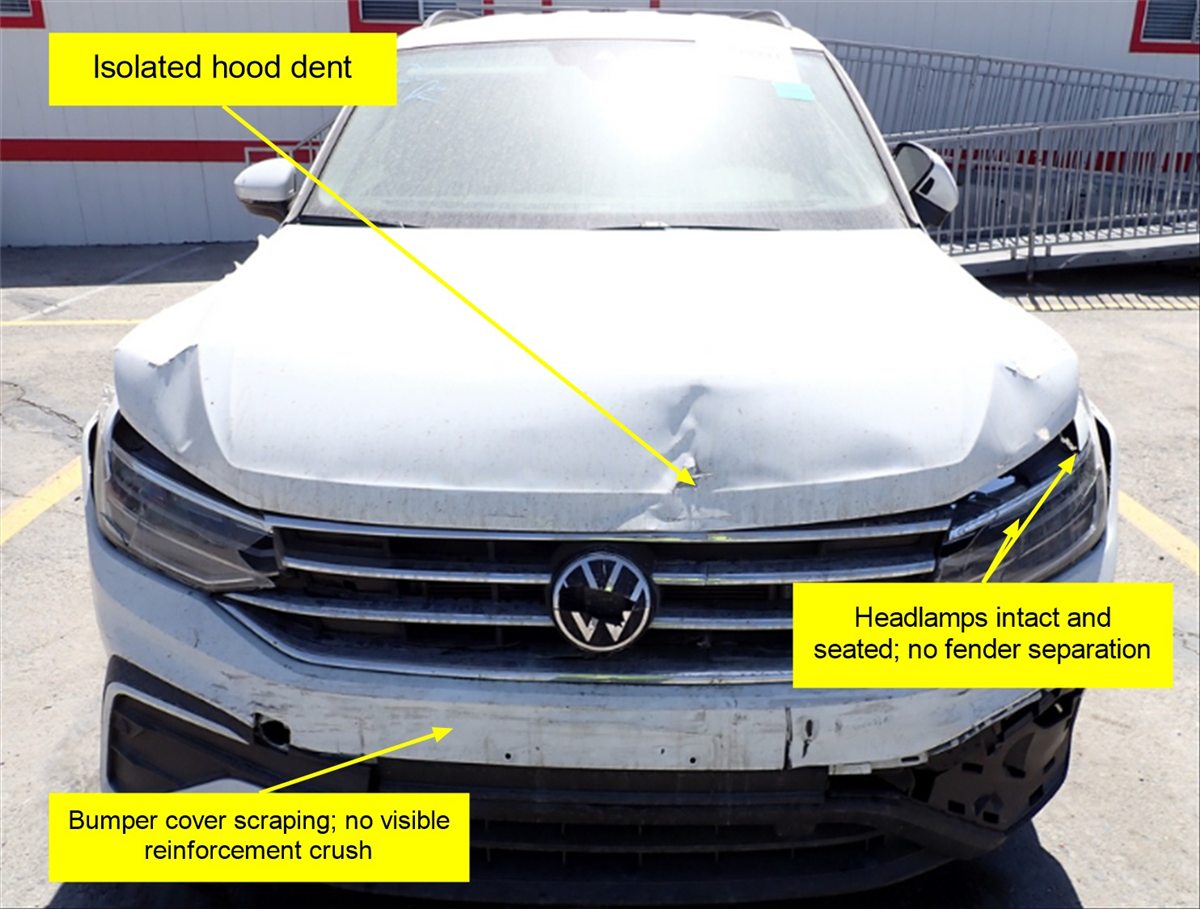
| Figure 3 | Field Inspection Image | |
The front of the Tiguan shows damage limited to the bumper cover, the grille, and a small area of the hood. The bumper cover is scraped and torn at its lower edge, and the grille is cracked. There is no visible displacement of the bumper reinforcement or radiator support, the headlamps are intact and seated, and the fender-to-bumper gaps are even. This low-energy, cosmetic damage is consistent with the 5.6 mph delta-V recorded by the ACM.
The hood has a shallow, isolated dent near its centerline. At the point of rest (Figure 5), the Tiguan's left headlamp area is against the GMC; the center of the hood is not in contact with any part of the GMC. The hood dent may be from a separate event. A prior-loss search and prior photographs, if any exist, would clarify this.
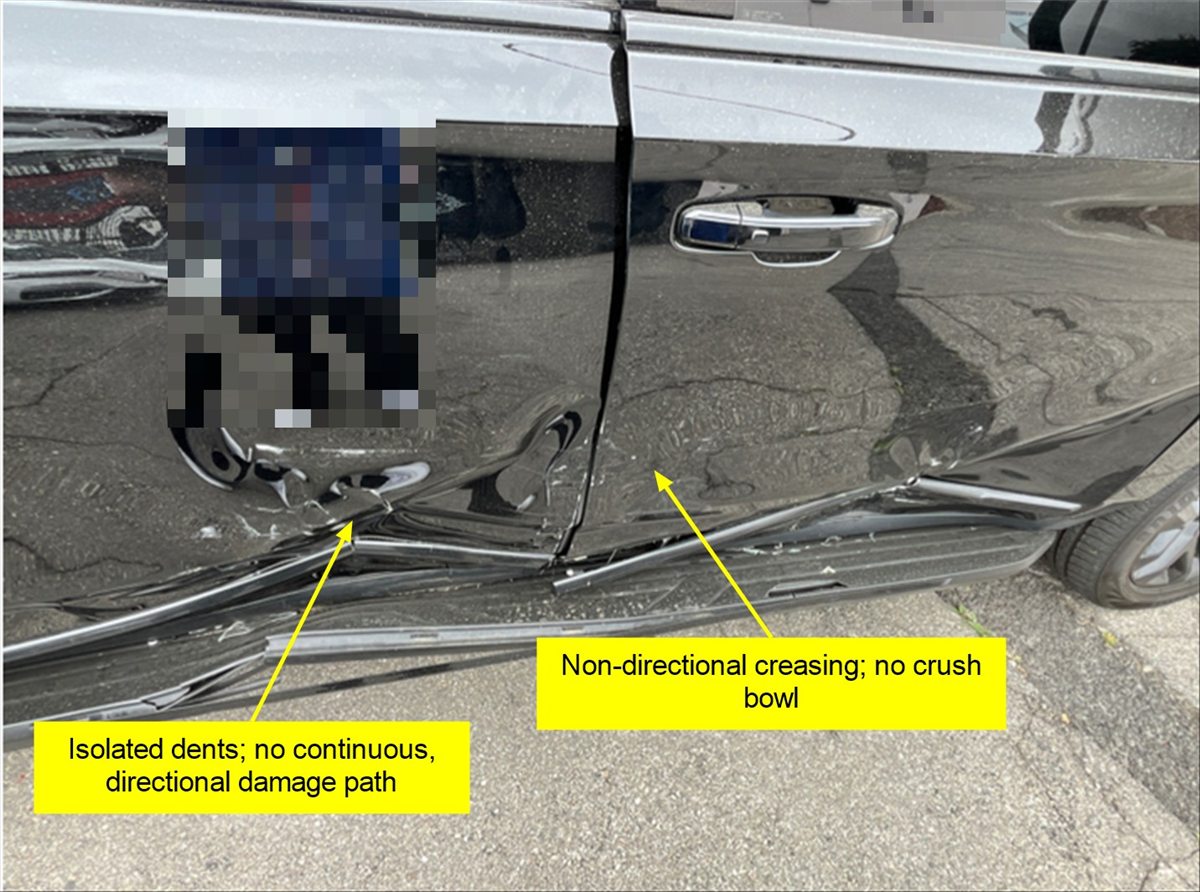
This photograph shows the right-side doors of the GMC. The damage consists of shallow inward deformation across the lower portion of both doors and into the rocker panel. The metal displays non-directional creasing and surface scratching without a defined crush bowl or a clear point of force application. When a vehicle strikes the side of another, the contact usually leaves a defined area of crush shaped like the striking vehicle's front, often with directional scrapes and paint transfer. Here, the dents are isolated and point-specific, and they extend along both doors rather than being concentrated where the Tiguan came to rest.
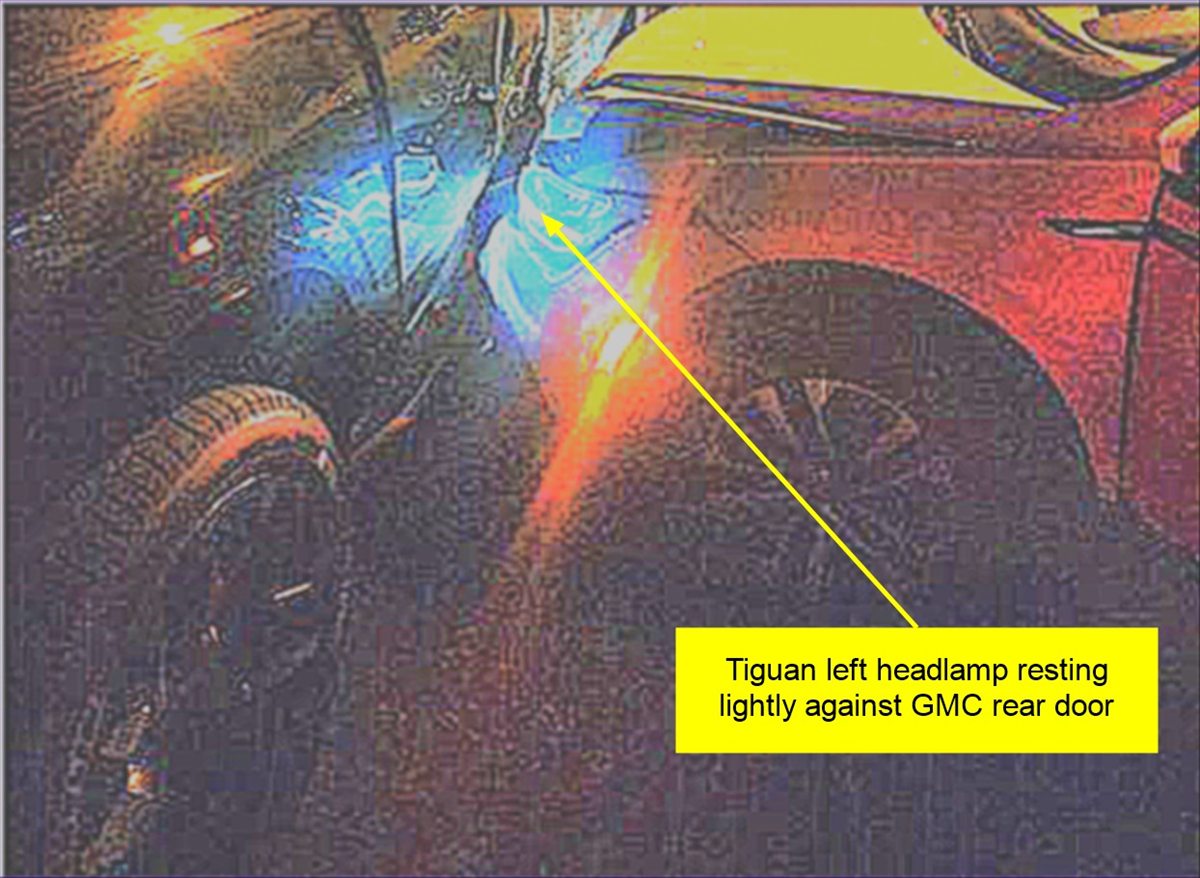
| Figure 5 | Supplied Scene Photograph | |
The scene photograph, taken at night, shows the Tiguan's left headlamp area resting against the rear passenger-side door of the GMC, with no separation between the vehicles. Light contact at rest with no post-impact travel is consistent with a low-speed collision of the severity recorded by the ACM.
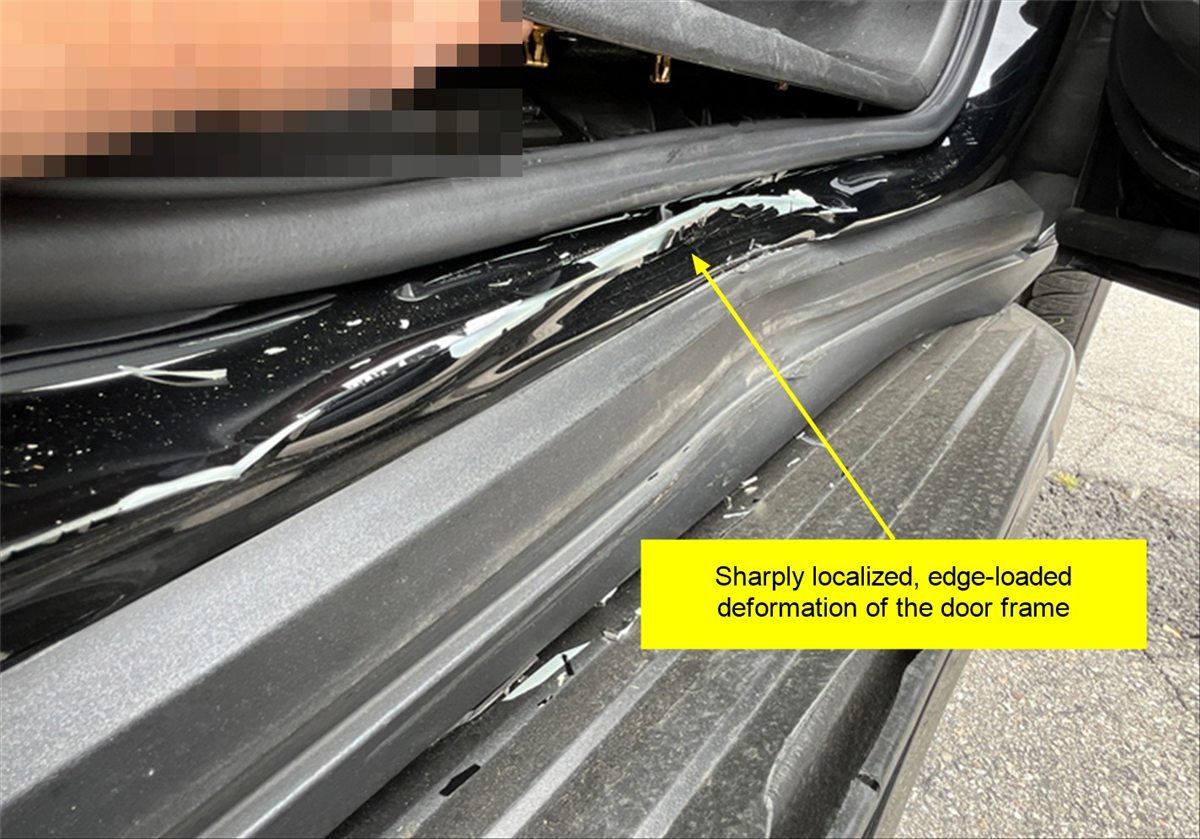
With the front door open, the door frame and sill show sharply localized deformation rather than broad, evenly distributed loading. The light-colored marks along the frame are consistent with exposed primer where the black paint has fractured and flaked, rather than with white paint transferred from the Tiguan. This area sits behind the closed front door, forward of where the Tiguan came to rest.
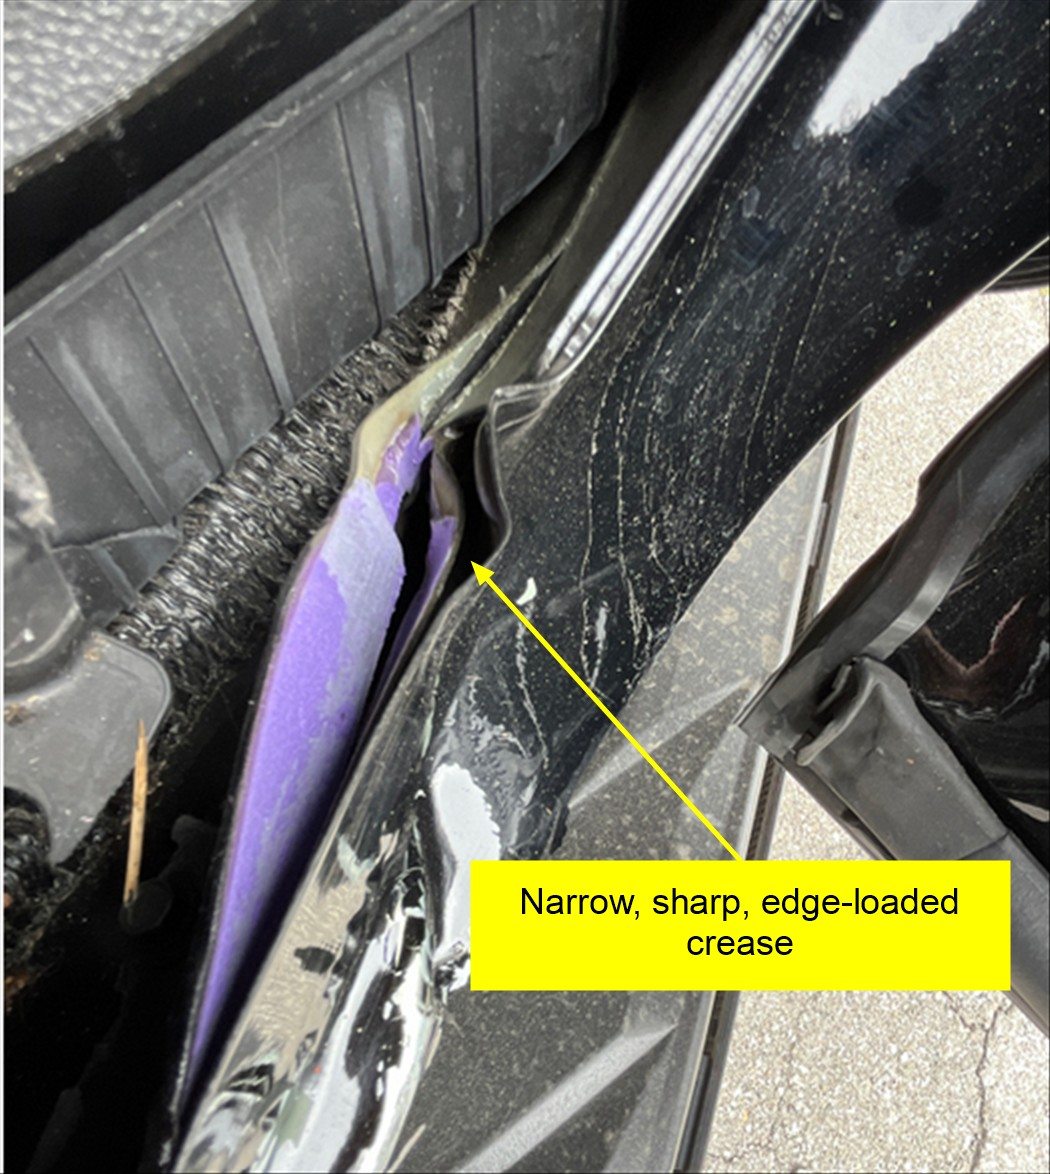
The close-up shows a sharp inward crease, fractured paint, and exposed inner material. The narrow, irregular, sharply defined deformation indicates point-specific, edge-loaded contact rather than the broad loading expected from a vehicle's bumper cover and reinforcement, which are wide and rounded. These characteristics are evaluated in the AED section below.
Artificially Enhanced Damage (AED)
Artificially Enhanced Damage (AED) is a process of using many different materials, tools, and objects to visually enhance or create damage on body panels, components, and wheels to mimic collision damage and inflate the repair estimate.
Both vehicles were evaluated for indicators of AED using the photographs provided. An indicator is a characteristic commonly associated with AED; no single indicator establishes that damage was enhanced.
No indicators of AED were identified on the Tiguan. Its bumper and grille damage is consistent with the recorded event, and its hood dent is addressed above as a possible separate event.
On the GMC, the narrow, edge-loaded creases in the door frame, sill and rocker are the strongest indicator. Damage of this shape is commonly associated with tool-based loading or prying. It does not resemble the loading produced by the Tiguan's bumper, and part of it is located behind the closed front door, an area the Tiguan's front end could not reach without first deforming the door skin over it.
Other explanations were considered. Concentrated creases can also be produced by contact with a small rigid object, such as a post, a curb-side fixture, or the corner of another vehicle, in a separate event. The photographs do not allow these possibilities to be excluded, but none of them is consistent with this collision.
Based on the photographs provided, indicators consistent with possible AED were identified on the GMC. AED cannot be confirmed from photographs alone. A physical inspection of the GMC's right-side doors, door frame, sill and rocker, looking for tool impressions, pry marks and paint-layer disturbance, would confirm or rule it out. Repairs listed on the GMC estimate for these areas should be reviewed against the findings in this report.
Insured's Statement Compared with the Evidence
In his examination under oath, the insured stated that he was driving downhill on Ridgecrest Avenue toward Canyon View Boulevard, "did not notice the stop sign," and continued straight into the intersection at approximately 40 mph, braking just before the impact. He stated that both vehicles stopped immediately.
Limitations
- The GMC was not inspected, and its model, weight and event data, if any, were not available. The momentum check uses a bracketed weight range.
- Tool marks cannot be identified or excluded from photographs. The AED findings are indicators only.
- The opinions in this report are based on the photographs and documents listed. Inspection of either vehicle, or additional records, could change them.
Summary
The Tiguan's EDR recorded a single non-deployment frontal event at 10:27 p.m. on the reported date of loss, at a mileage consistent with the vehicle's odometer. The recorded delta-V of 5.6 mph matches the cosmetic damage to the Tiguan's bumper and grille, the light contact shown at the point of rest, and the range expected from a momentum analysis of contact with the GMC at about 11 mph. A collision between the two vehicles occurred.
The collision did not occur as the insured described. The pre-crash data shows the Tiguan pulling away from a stop with the steering wheel turned to the right, accelerating to 11 mph without braking, not traveling straight through a missed stop sign at about 40 mph.
The GMC's damage is only partly consistent with this collision. Its door frame, sill and rocker show narrow, edge-loaded creases that the Tiguan's bumper would not produce, including damage behind the closed front door. These are indicators consistent with possible Artificially Enhanced Damage, which a physical inspection of the GMC would confirm or rule out.
Conclusion
- A low-speed collision between the Tiguan and the GMC occurred on the reported date. The Tiguan's ACM recorded a non-deployment frontal event with a 5.6 mph delta-V, consistent with a momentum analysis of the contact.
- The collision did NOT occur as the insured described. The Tiguan was pulling away from a stop, with the steering wheel initially turned to the right, and reached about 11 mph with no braking.
- The damage to the Tiguan's bumper cover and grille is consistent with the recorded event. The isolated hood dent does not align with the contact and may be from a separate event.
- The narrow, edge-loaded creases in the GMC's door frame, sill and rocker are NOT consistent with this collision.
- Indicators consistent with possible Artificially Enhanced Damage (AED) were identified on the GMC. AED cannot be confirmed from photographs; a physical inspection of the GMC is recommended.
The opinions expressed in this report are based on the information available as of the writing of this report. As such, this expert reserves the right to alter those opinions if additional information is made available. Additional information, however, would require a re-evaluation of the facts.
Respectfully submitted,
Zachary Sprague
Collision Reconstructionist, Accident Dynamics USA LLC
CA POST Certified – Basic, Intermediate, Advanced, Reconstruction
Pedestrian / Bicycle Collision Analysis
Crush Energy & Damage Profiling (Vehicle Dynamics)
Event Data Recorder (EDR) Analyst
About this sample. This is a fictional case prepared to show the structure and analysis of an Accident Dynamics USA report. The parties, locations, claim numbers and data were created for demonstration. Photographs are from past reviews, with identifying features removed. Request a free quote at accidentdynamicsusa.com/quote.
© 2026 Accident Dynamics USA LLC. All rights reserved. This sample may not be copied, reproduced or used as a template without written permission.
Sample report · Fictional case for demonstration
This report is prepared for
Maria Delgado
Private Client
Regarding
Three-Vehicle Intersection Collision: Collision Sequence and Fault
Findings at a Glance
Assignment
Accident Dynamics USA was retained by Ms. Maria Delgado, the driver of the 2014 Nissan Altima, to determine the sequence of a three-vehicle collision, whether her vehicle was stopped or moving when it was struck, whether her vehicle caused or contributed to the collision, and which driver had the right of way. The driver of the 2011 Honda Civic has alleged that the Altima rolled past the limit line into the intersection, forcing the other vehicles to react, and that the Altima is responsible for the collision. The Civic driver has also stated that he was traveling southbound on Linden Avenue, not northbound as recorded in the collision report, so his direction of travel was also evaluated.
Documents Reviewed
- Traffic Collision Report No. 26-091207, including the officer's scene diagram (no measurements recorded).
- Scene photographs taken by a bystander, showing the vehicles at final rest.
- Photographs of all three vehicles at the storage facility.
- Bosch CDR report for the 2014 Nissan Altima, downloaded with the client's written authorization.
- Written statements of the three drivers.
- Statements of two independent witnesses (W-1 and W-2), as recorded by the investigating officer in the collision report.
- Google Maps aerial imagery of the intersection, measured with the Google Maps distance measurement tool.
- Published curb weights for all three vehicles.
Conclusions
Based on a thorough review of the submitted material, collision reconstruction training, and professional experience, it is the opinion of this expert that the client's 2014 Nissan Altima was stopped behind the limit line, in its own lane, when it was struck, and that it did NOT cause or contribute to this collision.
The collision began when the westbound Honda Fit and the northbound Honda Civic collided in the intersection. Both vehicles rotated as they separated, producing mirrored rear-slap damage to the Fit's left-rear quarter and the Civic's right-rear quarter. The Fit then traveled 51.7 feet northwest and struck the front-left corner of the stationary Altima. The Altima's event data recorder shows it at 0 mph with the brake applied for the full five seconds before it was struck. The Civic driver's account that the Altima entered the intersection is NOT consistent with the physical evidence. The client's EDR data, two independent witnesses and the signal phasing show that the westbound Fit had the green signal and the northbound Civic entered the intersection against a red signal.
Discussion
The only questions considered for the purpose of this report are those requested in the case assignment.
Background Information
The collision was reported to have occurred at about 2:15 p.m. on Saturday, September 12, 2026, at the signal-controlled intersection of Harbor View Boulevard and Linden Avenue in Sample City, California. Harbor View Boulevard is a one-way, three-lane westbound street. Linden Avenue is a two-way street with two lanes in each direction, separated by a painted median. The posted speed limit on both streets is 35 mph. The weather was clear and the asphalt was dry.
According to the collision report, which relied on the Fit driver's and the client's statements, the Honda Fit (V1) was westbound on Harbor View Boulevard, the Honda Civic (V2) was northbound on Linden Avenue, and the client's Nissan Altima (V3) was southbound on Linden Avenue, stopped for the signal. The driver of the Civic gave a different account. He stated that he was traveling southbound on Linden Avenue, that the Altima "pulled out past the line," and that the Fit swerved to avoid it. The client stated that she was stopped for a red light when the Fit came toward her after colliding with the Civic. The Fit driver stated that her light was green. The collision report also records statements from two independent witnesses interviewed by the officer at the scene: W-1, the driver of a pickup stopped behind the Altima, and W-2, a pedestrian waiting on the northeast corner. The Civic driver stated that his light was green.
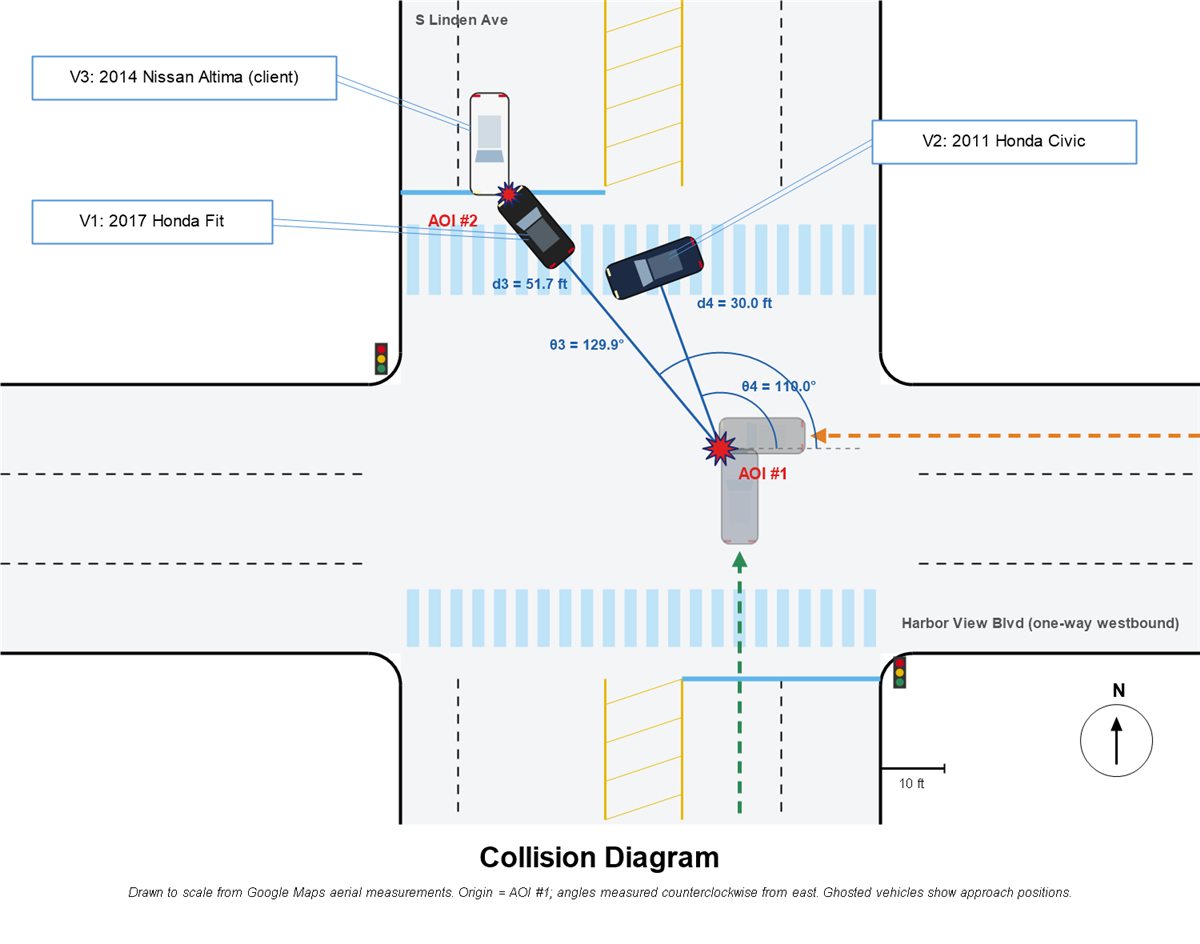
| Figure 1 | Accident Dynamics USA Diagram | |
Vehicle Description
Information from Photographic Evidence
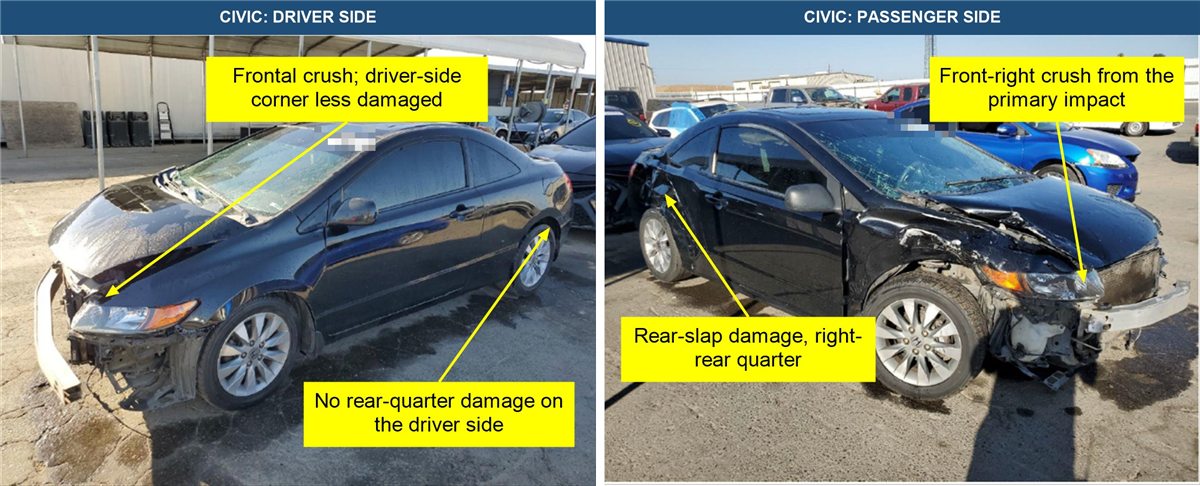
| Figure 2 | Supplied Images, Honda Civic (V2) | |
The Civic has frontal crush across the bumper, hood and radiator support, with the front-right corner more heavily displaced than the front-left. Its right-rear quarter panel and bumper corner are crushed inward, while the left-rear quarter is undamaged. Damage at the front and at only one rear corner, with nothing between them, indicates two separate contacts.
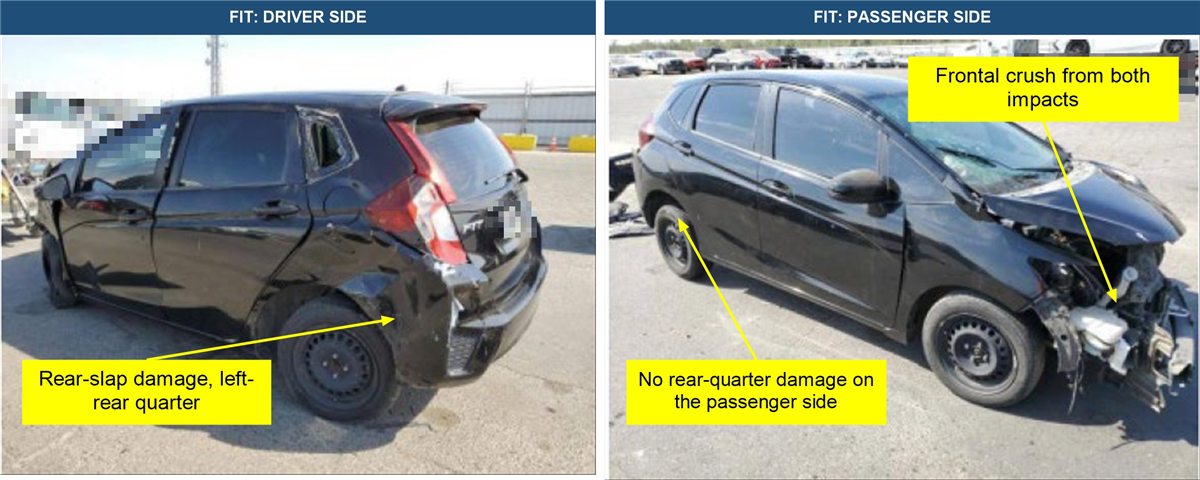
| Figure 3 | Supplied Images, Honda Fit (V1) | |
The Fit has heavy frontal crush, with the bumper, radiator support and both front corners displaced. Its left-rear quarter panel and bumper corner are crushed inward, and the right-rear quarter is undamaged. The rear damage on the Fit and the Civic is on opposite sides of the two vehicles. That mirrored pattern is the signature of a rear slap, described in the Collision Sequence section.
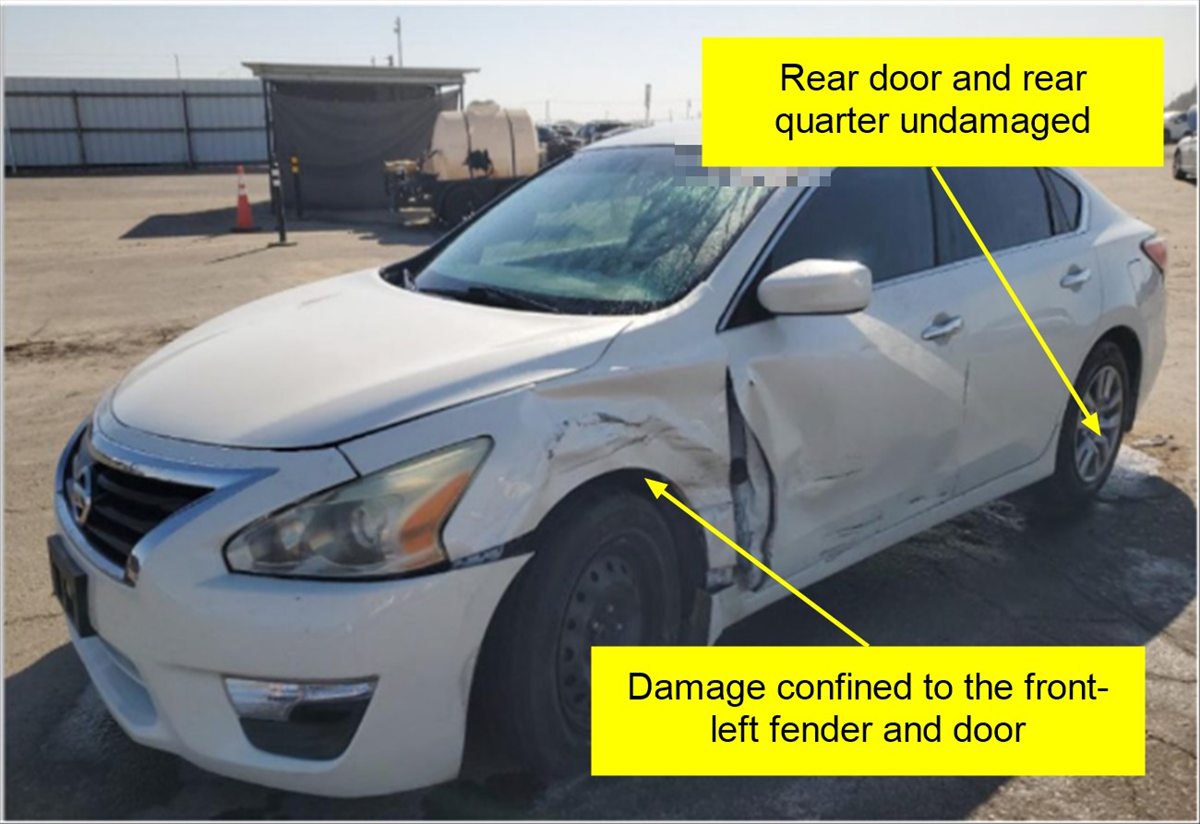
| Figure 4 | Supplied Image, Nissan Altima (V3) | |
The Altima's damage is confined to its front-left fender and the leading edge of the left front door, which are pushed inward and rearward. The front bumper face, grille and hood are undisturbed, and there is no damage to the rear or the right side. A vehicle that strikes another is damaged on its front face; this damage shows the Altima was struck at its front-left corner, not that it struck anything.
| Figure 5 | Supplied Scene Photograph | |
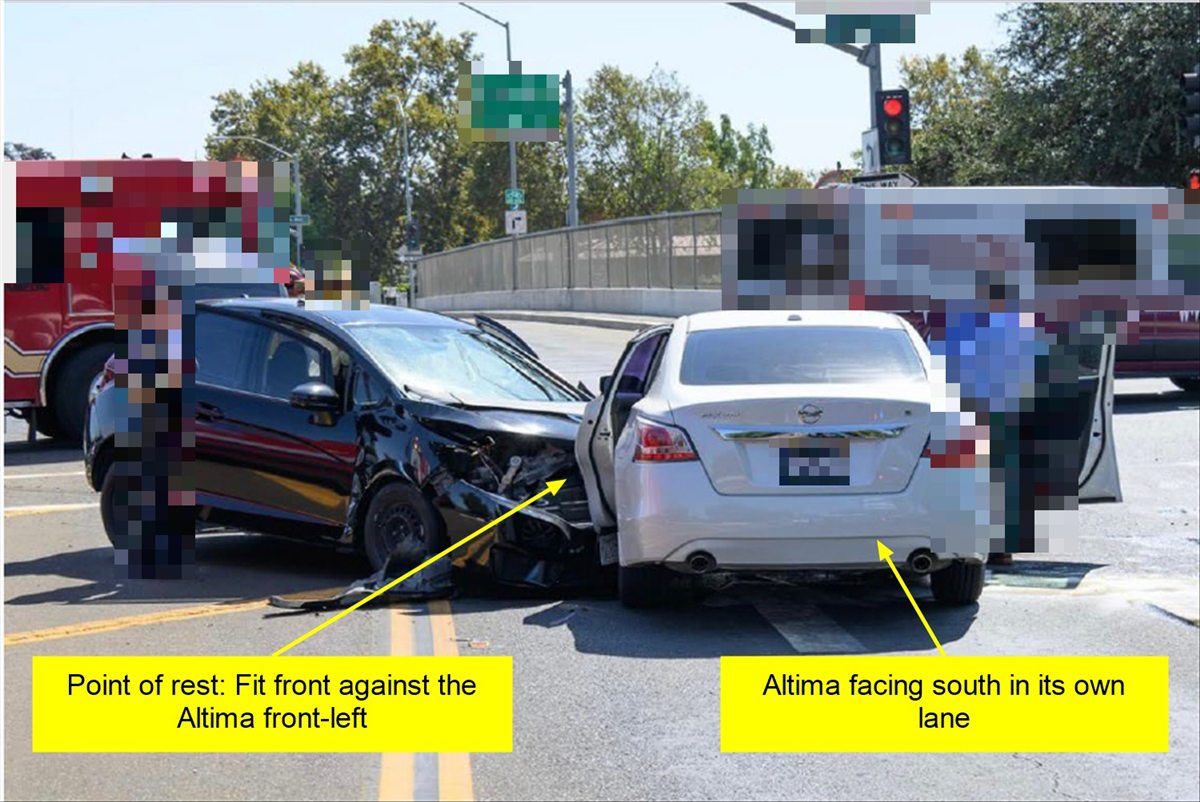
The scene photograph shows the Fit at rest with its front against the Altima's front-left corner. The Altima is straight in the inside southbound lane, behind the limit line. Its position and alignment show no sign that it moved into the intersection or turned. The Civic came to rest east of the Fit, across the median at the north crosswalk, outside the frame of this photograph.
Collision Sequence
1. Primary impact (AOI #1)
The westbound Fit and the northbound Civic collided in the intersection, front to front at an oblique angle. Each vehicle's front was pushed away from the other, which started both vehicles rotating.
2. Rear slap
As the two vehicles rotated, their rear ends swung toward each other. The Civic's right-rear quarter struck the Fit's left-rear quarter. This secondary contact, commonly called a rear slap, can only occur between two vehicles that have just collided and are rotating apart. The Altima has no rear or side damage that could have produced it, so the Civic and the Fit collided with each other before any vehicle reached the Altima.
3. Terminal impact (AOI #2)
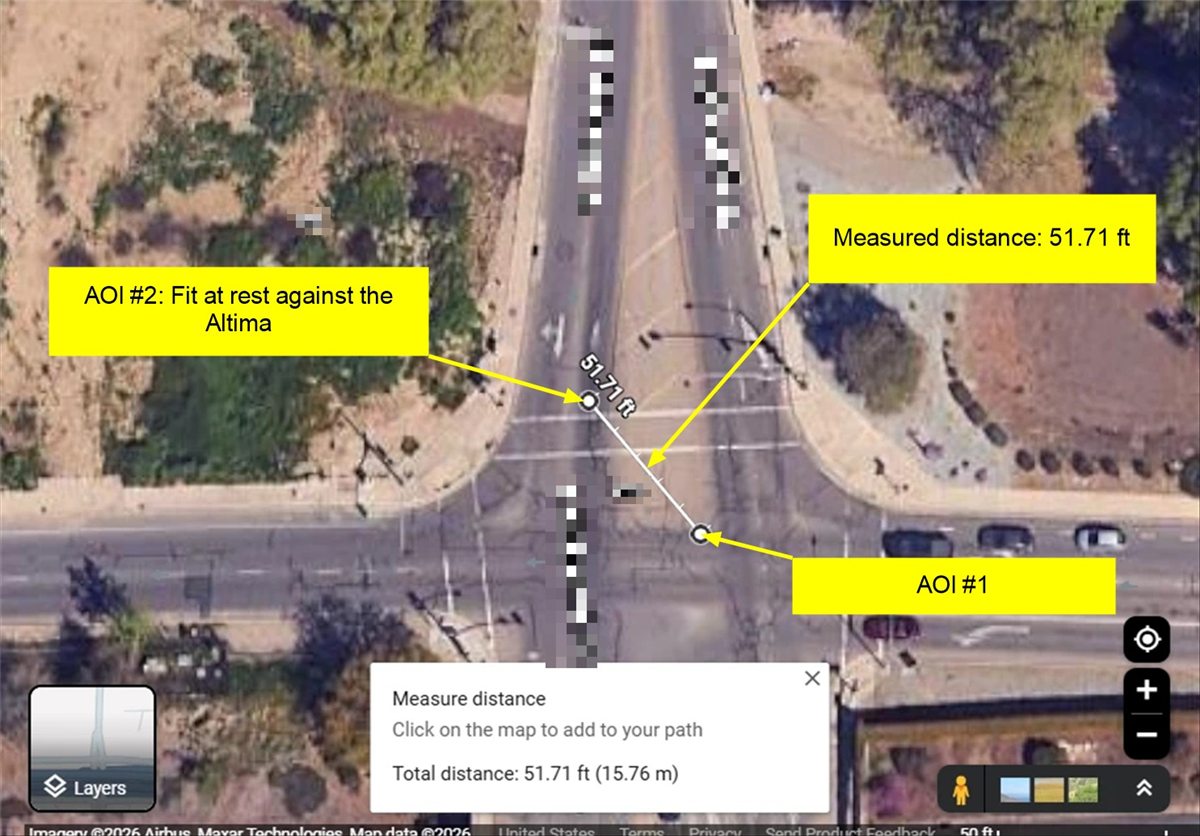
The Fit separated from the Civic and traveled 51.7 feet northwest to the southbound limit line, where its front struck the Altima's front-left corner. The Fit and the Altima came to rest in contact, as photographed. The Civic traveled 30.0 feet north-northwest and came to rest across the painted median at the north crosswalk.
Direction of Travel of the Civic
The Civic driver stated that he was traveling southbound. The side of the rear-slap damage and the vehicles' rest positions show that he was traveling northbound. Each is an independent test.
Test 1: Which rear corners slapped
When two vehicles collide front to front at an angle and rotate apart, their rear ends swing toward each other on the sides that faced each other at impact. The Fit was westbound, so its left side faced south. A northbound Civic approaches the Fit from the south with its right side toward the Fit; a southbound Civic would approach from the north with its left side toward the Fit.
The Civic's frontal crush is also heavier on its front-right corner, the side that faced the westbound Fit if the Civic was northbound.
Test 2: Where the vehicles came to rest
After the primary impact, both vehicles moved north: the Fit traveled 39.7 feet north (51.7 feet in all) to the Altima and the Civic came to rest 28.2 feet north of the impact. Before the impact the westbound Fit had no north-south momentum, so all of the northward momentum after the impact had to come from the Civic. The north-south momentum equation in the Speed Analysis section shows this directly:
m2v2 = m1v3 sin θ3 + m2v4 sin θ4 = +114,282 lb·mph (northward)
A southbound Civic would have carried southward momentum into the collision, and the two vehicles' combined movement after the impact would have been to the south. Instead, both vehicles moved north. That is only possible if the Civic was northbound. In addition, W-1, who was stopped behind the Altima in the southbound lanes, described no southbound vehicle passing them into the intersection.
Both tests independently show that the Civic was traveling northbound. The Civic driver's statement that he was traveling southbound is not consistent with the physical evidence.
Information from Bosch CDR Report (Client's Altima)
The Altima's airbag control module was downloaded with the Bosch CDR tool, with the client's written authorization. It recorded one non-deployment event. The CDR reports speeds in kilometers per hour; they are converted to miles per hour in this report.
Table 1. Recorded event data.
Table 2. Pre-crash data, recorded every 0.5 seconds.
The Altima was stationary, with the brake applied and no accelerator input, for the entire five seconds before it was struck. It did not roll forward. The Altima faced south (270°) and the Fit arrived traveling at 129.9°, so the force on the Altima came from 309.9°, which is 39.9° to the left of the Altima's heading. That matches the recorded principal direction of force of about 40° left, and confirms that the impact came from the Fit along the path measured on the aerial imagery (Figures 1 and 6).
Scene Measurements: Area of Impact to Point of Rest
The collision report shows the area of impact and the rest positions on the officer's diagram but does not include measurements, which is common. The distances and directions were therefore measured from Google Maps aerial imagery of the intersection, using the Google Maps distance measurement tool.
- Locating the points. AOI #1 was placed where the officer's diagram and the scene photographs show the gouge marks and the center of the fluid and debris field, in the northernmost westbound lane just east of the Linden Avenue median. The Fit's rest position (AOI #2) was placed from the scene photograph (Figure 5), at the southbound limit line in the inside southbound lane, using the curb lines, limit line, crosswalk, median and lane lines as landmarks. The Civic's rest position, outside the frame of Figure 5, was placed from the officer's diagram and a second bystander photograph showing the Civic across the median at the north crosswalk.
- Measuring. The distance from AOI #1 to each rest position was measured with the distance tool. The measurement to the Fit is shown in Figure 6; the measurement to the Civic was made the same way. The direction of each line was measured against the east-west lane lines of Harbor View Boulevard.
- Checking the measurements. Each distance was measured twice, and the two measurements agreed within 1 foot.
| Figure 6 | Google Maps Measurement (Imagery ©2026 Airbus, Maxar Technologies; Map data ©2026 Google) | |
The measured distances and directions were converted to east-west (x) and north-south (y) components, with the origin at AOI #1:
Δx = d × cos θ Δy = d × sin θ
Fit (V1): d3 = 51.7 ft, θ3 = 129.9°
Δx = 51.7 × (−0.6414) = −33.2 ft Δy = 51.7 × 0.7672 = 39.7 ft
Civic (V2): d4 = 30.0 ft, θ4 = 110.0°
Δx = 30.0 × (−0.3420) = −10.3 ft Δy = 30.0 × 0.9397 = 28.2 ft
As a check, the Fit's components return the measured distance: √( 33.2² + 39.7² ) = √2,678.3 = 51.8 ft, within 0.1 ft of the Google Maps measurement of 51.71 ft.
Speed Analysis
The speeds of the Fit and the Civic were reconstructed in three steps, working backward from the end of the collision sequence. Distances and angles are from the Scene Measurements section, with the origin at AOI #1, east as the positive x-direction and north as the positive y-direction. Angles are measured counterclockwise from east.
Step 1: The Fit's speed when it struck the Altima
The Altima's recorded delta-V and the two vehicles' weights give the Fit's speed at AOI #2. For a stationary vehicle that is struck, momentum and restitution give:
ΔV3 = [ m1 ÷ (m1 + m3) ] × (1 + e) × Vc ⇒ Vc = ΔV3 ÷ { [ m1 ÷ (m1 + m3) ] × (1 + e) }
Vc = 4.85 ÷ { [ 2,740 ÷ (2,740 + 3,320) ] × (1 + 0.15) } = 4.85 ÷ (0.452 × 1.15) = 9.3 mph
Using a restitution range of 0.10 to 0.20, the Fit's speed at AOI #2 was between 8.9 and 9.8 mph. This equation treats the corner impact as a straight-line collision, which is an approximation for an oblique contact. The result has little effect on the speeds below: even if the Fit's speed at AOI #2 were anywhere from 0 to 15 mph, the Fit's speed before the primary impact would change only between 24.3 and 26.8 mph, and the Civic's between 37.9 and 40.7 mph.
Step 2: Post-impact speeds leaving AOI #1
After the primary impact, both vehicles slid with locked or damaged wheels. The slide-to-stop equation gives the speed needed to cover a measured distance with a given drag factor. For the Fit, which was still moving at 9.3 mph when it reached the Altima, that speed is added:
S = √( Send² + 30 × d × f )
Fit (V1): d = 51.7 ft, Send = 9.3 mph
v3 = √( 9.3² + 30 × 51.7 × 0.45 ) = √( 86.5 + 698.0 ) = √784.5 = 28.0 mph
Civic (V2): d = 30.0 ft, came to rest
v4 = √( 30 × 30.0 × 0.45 ) = √405.0 = 20.1 mph
Step 3: Pre-impact speeds (conservation of momentum)
Momentum is conserved separately in the east-west and north-south directions. Before impact the Fit was moving west (180°) and the Civic north (90°). After impact the Fit departed at θ3 = 129.9° and the Civic at θ4 = 110.0°.
East-west (x):
m1v1 cos 180° + m2v2 cos 90° = m1v3 cos θ3 + m2v4 cos θ4
−2,740 v1 = 2,740 × 28.01 × (−0.6414) + 2,930 × 20.12 × (−0.3420)
−2,740 v1 = −49,226 − 20,167 = −69,393 ⇒ v1 = 25.3 mph (Fit)
North-south (y):
m1v1 sin 180° + m2v2 sin 90° = m1v3 sin θ3 + m2v4 sin θ4
2,930 v2 = 2,740 × 28.01 × 0.7672 + 2,930 × 20.12 × 0.9397
2,930 v2 = 58,873 + 55,409 = 114,282 ⇒ v2 = 39.0 mph (Civic)
Check: equal and opposite changes in momentum
The change in each vehicle's velocity at AOI #1 follows from its velocity before and after the impact. The Fit's changed by 22.7 mph and the Civic's by 21.2 mph. Multiplying each by the vehicle's weight should give the same result, because the force each vehicle applied to the other was equal and opposite:
m1 × ΔV1 = 2,740 × 22.7 = 62,198 m2 × ΔV2 = 2,930 × 21.2 = 62,116
The two values agree within 0.2%, the difference coming from rounding the two delta-V values, which confirms the solution is internally consistent.
Sensitivity to the drag factor
Across the full range of drag factors, the Fit was traveling between about 23 and 28 mph and the Civic between about 35 and 43 mph. None of these results changes the collision sequence or the Altima's role.
Time available to the client
The Fit slowed from 28.0 mph to 9.3 mph over the 51.7 feet between the two impacts:
average speed = (28.0 + 9.3) ÷ 2 = 18.7 mph × 1.467 = 27.4 ft/s t = 51.7 ft ÷ 27.4 ft/s = 1.9 s
The client had about 1.9 seconds from the primary impact until she was struck. A typical driver needs about 1.5 seconds just to perceive and begin reacting to an unexpected hazard, which would leave her less than half a second to act. The Altima was stopped at the limit line with a crosswalk ahead and traffic around it, so no avoiding action was available.
Signal Phase and Right of Way
The intersection is controlled by a traffic signal in which northbound and southbound Linden Avenue move on the same signal phase, and westbound Harbor View Boulevard moves on a separate phase. The two phases never show green at the same time. When southbound Linden Avenue has a red signal, northbound Linden Avenue also has a red signal, and Harbor View Boulevard has the green.
Four sources establish which phase was green when the collision began. The witness and driver statements are quoted as recorded in the collision report.
The pedestrian signal for crossing Linden Avenue runs concurrently with the Harbor View Boulevard green, so W-2's walk signal means Harbor View had the green and Linden Avenue had the red. According to the collision report, W-1 and W-2 are not connected to any of the drivers, and the officer interviewed both at the scene. Their accounts agree with each other, with the Fit driver, and with the Altima's recorded data.
The physical evidence shows that the Civic did not stop for the signal. It was traveling at about 39 mph (57.2 ft/s) at the primary impact, which was about 36 feet past the northbound limit line. A vehicle starting from a stop at the limit line would need far more distance than that to reach 39 mph, even under hard acceleration of 0.40 g:
d = v² ÷ (2 × a) = 57.2² ÷ (2 × 0.40 × 32.2) = 3,272 ÷ 25.8 = 127 ft
The Civic therefore entered the intersection already traveling at speed, not after stopping at the limit line. That is consistent with the two independent witnesses and with the Altima being stopped at the red on the same signal phase.
Based on the client's EDR data, the two independent witnesses, the Fit driver's statement and the signal phasing, the westbound Fit had the green signal and the northbound Civic entered the intersection against a red signal.
Statements Compared with the Evidence
Limitations
- The Fit and the Civic were not inspected, and their event data was not available. Their speeds rely on the scene measurements, the drag-factor range and the published weights.
- The collision report did not include measurements. Distances were measured from aerial imagery, which is not an on-scene survey; the points were located from the officer's diagram and the scene photographs, and an error of one to two feet in any point would change the calculated speeds by less than 1 mph.
- The signal timing charts were not available. The analysis assumes the standard phasing described above, with no protected or leading northbound phase. The city's timing records should be requested to confirm this.
- These opinions are based on the materials listed. Additional information would require a re-evaluation.
Summary
The physical evidence shows a clear sequence. The westbound Fit and the northbound Civic collided in the intersection, rotated apart and struck each other again at their rear corners, leaving mirrored rear-slap damage that no contact with the Altima could have produced. The Fit then traveled 51.7 feet northwest and struck the front-left corner of the client's Altima.
The Altima's event data recorder shows it stopped, with the brake applied and no accelerator input, for the full five seconds before it was struck. Its damage is confined to the front-left corner where the Fit hit it, and the scene photograph shows it at rest behind the limit line in its own lane. A momentum analysis using the Altima's recorded delta-V, the scene measurements and the vehicle weights places the Fit at about 25 mph and the Civic at about 39 mph before the primary impact, and the analysis checks out with equal and opposite momentum changes.
The Civic driver's statements are not supported by the evidence. The side of the rear-slap damage and the northward travel of both vehicles after the impact show that the Civic was northbound, not southbound as he stated, and nothing shows that the Altima pulled past the line. His statement that his light was green is contradicted by the client's EDR data and by both independent witnesses recorded in the collision report, who place the Linden Avenue signal at red and the westbound green with the Fit.
Conclusion
- The client's 2014 Nissan Altima was stopped behind the limit line, in its own lane, with the brake applied, when it was struck.
- The collision began with an impact between the Honda Fit and the Honda Civic, followed by a rear slap between those two vehicles.
- The Fit then struck the Altima's front-left corner at about 9.3 mph, producing a 4.9 mph delta-V on the Altima.
- The Altima did NOT cause or contribute to this collision.
- The westbound Fit had the green signal. The northbound Civic entered the intersection against a red signal, as shown by the client's EDR data, two independent witnesses and the signal phasing.
- The Civic was traveling northbound. The Civic driver's statement that he was traveling southbound is NOT consistent with the side of the rear-slap damage or the rest positions.
- The Civic driver's account that the Altima entered the intersection is NOT consistent with the physical evidence.
The opinions expressed in this report are based on the information available as of the writing of this report. As such, this expert reserves the right to alter those opinions if additional information is made available. Additional information, however, would require a re-evaluation of the facts.
Respectfully submitted,
Zachary Sprague
Collision Reconstructionist, Accident Dynamics USA LLC
CA POST Certified – Basic, Intermediate, Advanced, Reconstruction
Pedestrian / Bicycle Collision Analysis
Crush Energy & Damage Profiling (Vehicle Dynamics)
Event Data Recorder (EDR) Analyst
About this sample. This is a fictional case prepared to show the structure and analysis of an Accident Dynamics USA report for a private client. The parties, locations, report numbers and data were created for demonstration. Photographs are from past reviews, with identifying features removed. Request a free quote at accidentdynamicsusa.com/quote.
© 2026 Accident Dynamics USA LLC. All rights reserved. This sample may not be copied, reproduced or used as a template without written permission.
